.png)
Many of you will be familiar with the so-called “hot-hand” fallacy, or (perhaps) the lack thereof. In 1985, Tom Gilovich (along with Robert Vallone and Amos Tversky) published a paper suggesting that there is no such thing as a hot hand, but rather a “general misconception of chance…and random sequences”. [1]
The analysis was originally focused on basketball, and as anyone who ever played hoops will attest, this was a hard one to swallow. I’ve sure at least felt like I had a hot hand, and I’ve damn sure felt like I’ve had a cold hand. And if a cold hand can exist, well, that means a hot one can too.
Yet for the ensuing two decades, there was much additional work corroborating Gilovich’s results. It became intellectual heresy to claim that a hot hand existed in hoops (unless you were a New York Knick fan and talking about Reggie Miller, in which case you got a pass).
In the last few years, however, there have been two papers that suggested that the Gilovich’s results may not have been as robust as everyone thought. The first one[2] pointed out that “hot” players start feeling so hot that they start taking shots from further away. Moreover, opposing teams will also adjust their defense to focus more primarily on the hot shooter. Using some pretty cool tracking data, they figured that the streaky shooter’s actual apples-to-apples FG percentage goes up 1-2% when he or she is “hot”. So this all makes sense and is kind of interesting, but a 45% shooter becoming a 46% or 47% shooter isn’t enough to debunk many of the great conclusions from Gilovich.
A potentially more interesting paper was simply about a quirk of statistics. This paper[3], by Josh Miller and Adam Sanjuro, suggests something very basic was at play, camouflaging the “hotness” of the shooter. Basically, if you look at datasets and start observing outcomes after the shooter makes his first shot, you are creating a sample bias.
Think about it like a coin flip. If you are trying to test for skill at flipping heads, and you flipped a coin four times (or shoot a basket as a 50% FG shooter), there are 16 possible, equally likely, outcomes.
HHHT HTTH TTTH THHT HHTH HTHT TTHT THTH
HHTT HTHH TTHH THTT HHHH HTTT TTTT THHH
To get to the bottom of things, if we look at each sequence and start with the first head that we find, we need to then calculate how many of the next flips (shots) in the sequence were also heads. Of these 16 sequences, 14 of them have a heads (a make) that is followed by another shot. Of these sequences, we can tally up the number of “heads” flipped directly after a heads was flipped, and then go to work.
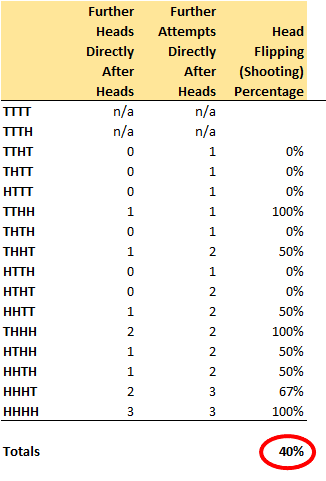
As we see in the table to the right, the average FG percentage of all the sequences where the shooter (the coin-flipper) shoots again after his first make is just 40%!
The perhaps unintuitive observation is that if someone is a 50% shooter, and you go back in time to look at a string of finite attempts, and if you start with a make within any of those sequences, the average FG% of the remaining shots in those sequences is only 40%!
The motivation here is that there is this kind of statistical penalty given conditional probabilities in the analysis of finite data. And thus if the analysis that Gilovich did only reveals that a 50% shooter is a 50% shooter after making a basket, that this means he actually is hot! Basically, in this simple description of it all, anything better than 40% would imply hotness.
Finally! The hot-hand exists!! There was much ballyhoo over this in both the sports industry and in academia. There a well-written description of the background here “How Researchers Discovered the Basketball ‘Hot Hand’”[4], and noted statistician Andrew Gelmer posted “Hey-guess what? There really is a hot hand!”.[5] Subsequently, Ben Cohen has written a tremendous book[6] describing the hot-hand in many aspects of life, and how Miller and Sanjuro ultimately turned the hot-hand fallacy into a fallacy itself.
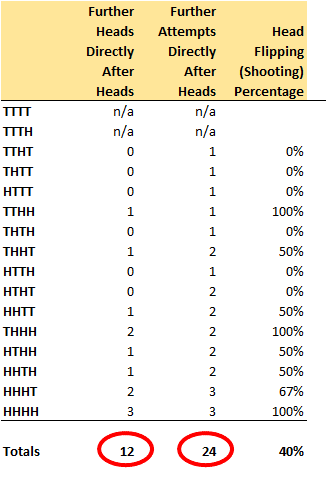
But hold on a second! Let’s go back and add up all the attempts after flipping heads (after making a shot) and see how many of them were heads. Within the sequences noted above, there are 24 attempts, and 12 makes. That’s 50%, not 40%.
In other words, the claim that “a given flip of heads is more likely to be followed by tails than by another heads” doesn’t actually appear to be true.
So is the debunking of the hot-hand fallacy simply based on a feature of taking averages of averages? Isn’t the likelihood of the 50% shooter making another shot after making the first one still just 50%?
Our conclusion: if Gilovich’s data set took the average of the sequence percentages, we agree with Miller and Sanjuro, and there probably is a hot-hand fallacy fallacy. If however Gilovich is looking at total shots taken within those sequences, then the hot-hand fallacy fallacy, is itself a fallacy.(i)
And in either event, Gilovich’s initial assertion is almost certainly still very true. People do not have a good sense of randomness, and tend to see patterns (and causality) when they don’t exist. None of this stuff is as intuitive as we’d like it to be.
---------------------------------------------------------------
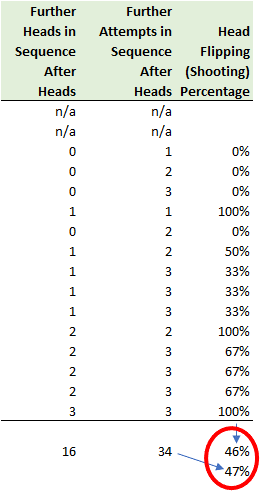
(i) An alternative interpretation of the heads and tails dataset is to look at further attempts remaining in the sequence after the first heads, and seeing how many of them were heads. In this case, the “average of the average” is not as low as 40%, but still is not 50% (it is 46%), but perhaps more interestingly, of the 34 coin flips, or shots, after a head (or a make) is first revealed, only 16 of them are heads. In this case the shooting percentage is 47% (16/34). If this probability matters, then it too would help debunk the hot-hand fallacy, thus making this entire process a hot-hand fallacy fallacy fallacy fallacy. 😊
FOOTNOTES
[1] https://www.cs.colorado.edu/~mozer/Teaching/syllabi/7782/readings/gilovich%20vallone%20tversky.pdf
[2] http://www.sloansportsconference.com/wp-content/uploads/2014/02/2014_SSAC_The-Hot-Hand-A-New-Approach.pdf
[3] https://papers.ssrn.com/sol3/papers.cfm?abstract_id=2627354
[4] https://www.thecut.com/2016/08/how-researchers-discovered-the-basketball-hot-hand.html
[5] https://statmodeling.stat.columbia.edu/2015/07/09/hey-guess-what-there-really-is-a-hot-hand/
[6] Cohen, Ben, The hothand: the mystery and science of streaks, 2020, Harper Collins
DISCLAIMER
The views and opinions expressed here are those of the post’s author and do not necessarily reflect the views of Albert Bridge Capital, or its affiliates. This post has been provided solely for information purposes and does not constitute an offer or solicitation of an offer or any advice or recommendation to purchase any securities or other financial instruments and may not be construed as such. The author makes no representations as to the accuracy or completeness of any information in this post or found by following any link in this post.
YOU MIGHT ALSO LIKE

Here We Go
I will try as always to be objective here, but maybe some bias will be revealed in the process. I hope not, and I am sure you will let me know if I do. Given how politically charged things can be these days, I am bound to upset someone. That is not my intention. Not one bit. I am trying to help. I’m trying to help our investors. I’m trying to help my friends. I’m trying to help myself.
Read More